StoryMap JS is a free tool that allows teachers to create interactive, visual stories through interconnected points along a map. Users tell stories (through a series of slides) that move over multiple locations of the world. Each point on the map is explicitly linked to the next and viewers can clink on a specific location to gain more information about the topic. For example, students can click various points to view pictures, text, video clips, or social media links.
There are various examples on the StoryMap website to get an idea of how it works. I could see using this application in Social Studies as it allows students to visualize people, places, and ideas around the world. Students could also create their own visual summaries of historical events and themes (like the Oregon Trail, or the Trail of Tears). I decided to explore StoryMap using my recent trip to Mexico as a guide. Each slide would be a place I visited with a corresponding point on the map. Besides adding my own photos, I was going to add links for the viewer to gain a better understanding of the area. Overall, I found the ease of use similar to creating a Powerpoint presentation. Once I got used to it, I began to feel confident about adding more and more slides.
In order to use the application you need to sign into your Google account. (While I was creating one, I found it easier to save all the images I was going to use into my Google drive. It helped me stay organized and it didn't take up space on my computer.)
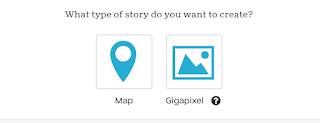
Step 1: Click on Make a StoryMap now. It will prompt you to sign into your Google account. Then you have to choose what type of story you want. [More on Gigapixel down below.]
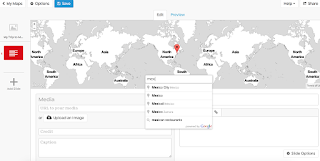
Step 2: The first slide you will make is your cover slide. When you begin to add more slides and locations, points will start to appear on your map summary.

After I created the slide, it prompted me to chose a location on map. You can put a specific address or a city/town.
StoryMap also has a a feature that allows users to create stories using one large photo instead. To help explain what I mean, here is an example:
Each point corresponds to an analysis of a specific area in the painting. I found this somewhat harder to create since you have to know how to edit and resize the photograph a certain way. Here is a nice
tutorial for those who are interested in creating one.


I love this tool. I will try it this year for my inventors unit since they are from all over the world. GREAT JOB!!!
ReplyDeleteThis sounds pretty neat! Might be a cool idea for back-to-school so the students can share their summer adventures!
ReplyDeleteI can see numerous possibilities for the history focused Church course I teach and for social issues in my ethics course on global awareness. Thank you.
ReplyDeleteI forgot to put my name on this post. If anyone has any questions, let me know!
ReplyDeleteThis is really cool tool. I totally want to use it!
ReplyDelete